How To Use TradingView Charts To Trade Stocks In India?
TradingView charting system is designed to cater to traders across the globe.
It offers the opportunity to analyze and research various financial assets. Likewise, the platform allows users to network with other traders and discuss their script ideas.
Forthwith, this advanced Tradingview charts platform offers the latest indicators and tools that will help you study and enhance your technical skills.
What Are The Features Of Tradingview Charting Platform?
Once you have logged into the platform, you can see trading ideas hosted by other trades on the web portal. In addition, it also has information about the following:
Local and global market index
Nifty live tracker
Commodity
Other active security
National and international news
Obviously, necessary information related to trading is easily accessible on the platform. Regardless, traders have a great opportunity to conduct their research and formulate their trading strategies with Tradingview charts.
Subsequently, let us now dive deeper into how you can navigate your way on the trading platform.
? Firstly, You can sign up on the portal with your Google account.
? Secondly, the cloud will save all your work on the Charts, which you can access anytime.
? Next, if you are a first-time trader, you can move to the “Ideas” section and learn from the setup of other experienced traders.
? Lastly, if you have experience, you can directly move to the “Scanner” section to locate your trade setup.
What Are The Available Options In Tradingview Charts?
Evidently, there are many sections available in the tradingview options charts. Eventually, here are some of the available options in the charts by which you can see the present Tradingview charts and statics.
Let us now understand the various sections in the ?Chart? section.
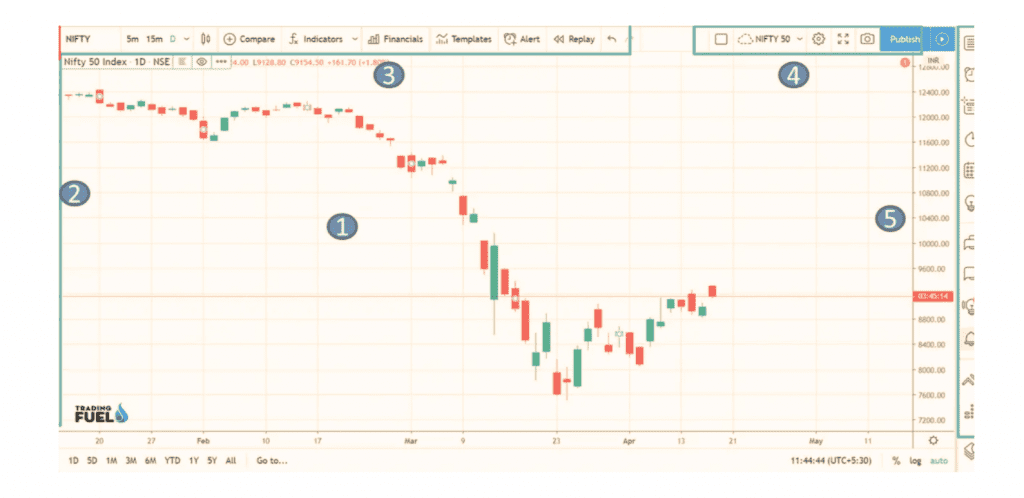
? The Menu is right at the top (1) – it can be used to create price alerts, perform a comparison between different charts, modify the time frame and apply chart type indicator (3)
? You will find concurrently charting tool on the left-hand side (2)
? (4) can be utilized to create a fresh profile or switch between different layouts
? You can use (5) to publish your new trade idea or create a specific watch list
? Chiefly, option (6) is useful for sharing your research with other traders on the platform
What Are The Functions Of These Options?
Do you know what are the features of Tradingview charts? But when you are a trader, then also these functions are no longer just for seeing. Because you can do many more things apart from the trading analysis and the profit-making potential.
Additionally, you have gained an overview of the features available in a single window. Let us now learn about the functionality of each chart and toolbar on the platform:

1st Toolbar – Basically, the drawing and charting tools are available in this toolbar. Long/short positions can be formed here. While, you can right-click on each tool to find the extended selection to choose options.
2nd Toolbar– Particularly, it offers flexibility in modifying the chart type. You can select line graphs, candlesticks, and area graphs. Specifically, you can choose the ?indicators and strategies? button to insert predesigned analysis. The search bar on the left allows you to change the asset on display.
3rd Toolbar– Straightaway, the ?Strategy Tester? button can be used to test strategies.
4th Toolbar – Personalized calendar can be accessed here. Therefore, traders can reach out to one another and share their ideas. Generally, this toolbar covers social elements.
Chart Area – Accordingly, every section visible to the trader can be customized. Undeniably, If you change the asset and use any indicator, it will all be reflected in the primary chart area.
Can You Share The Tradingview Charts?
After all the Trading view charts are all available, but creating a chart is not all. Furthermore, you also can share your already created charts with other traders for reference. Even though, you create the charts as the forecasting statics, this will also go to work.
Moreover, you can also share the chart without giving editing permissions to the viewers. If your analysis is going to be more fruitful, your viewers will start to follow your instructions.
Conclusion
Finally, using Tradingview charts can be a good start for online web trading. Particularly, you can utilize the information available on the platform to the best possible extent and plan your investment strategies. In this case, additionally many of the inverters do not feel convenient due to the online trading functions, so they are taking help from the trading agents. This is more like a primary study to know the tricks of online trading.
Additionals: